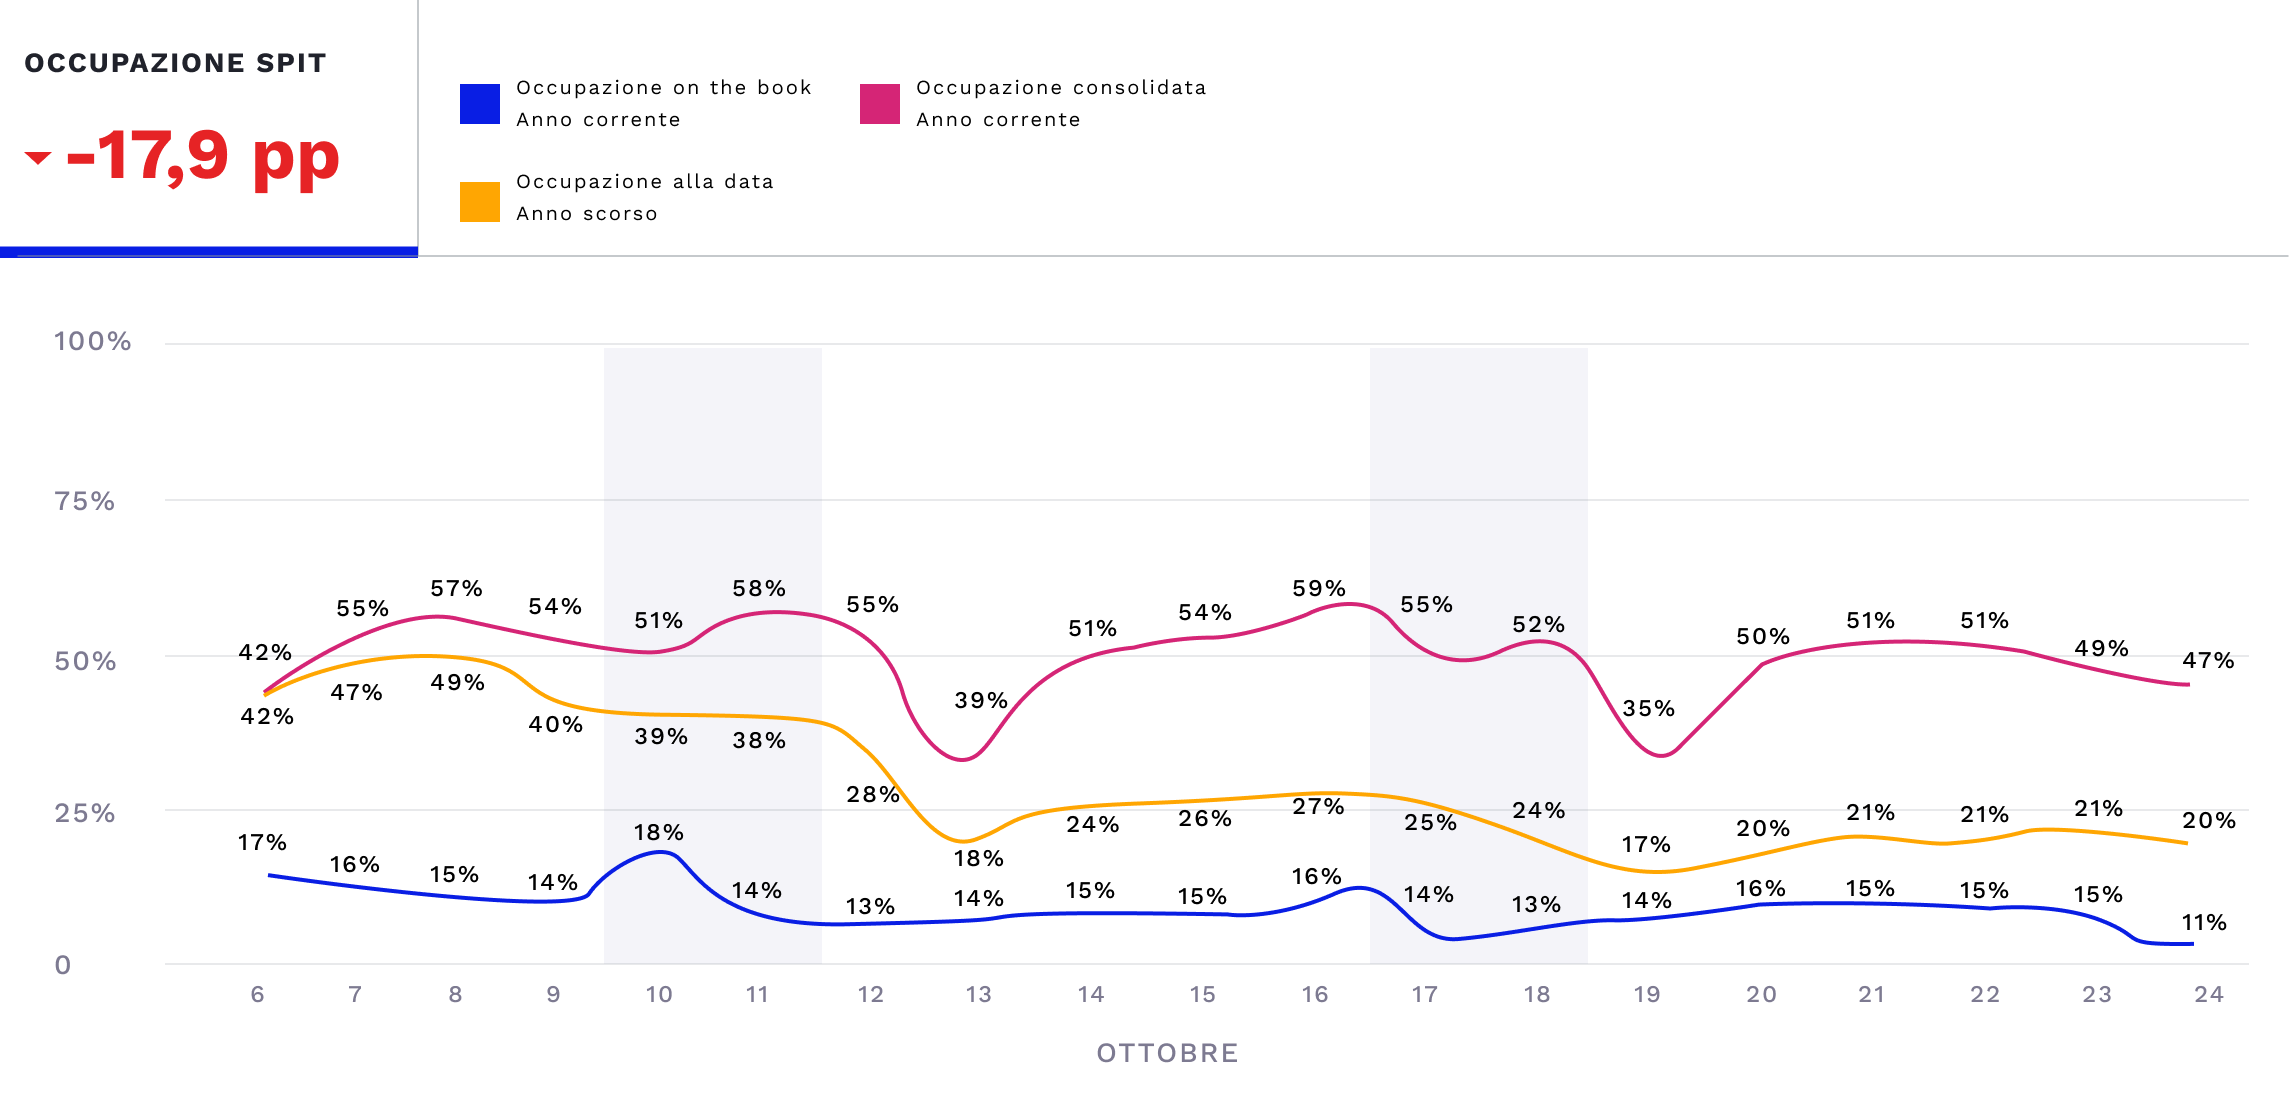
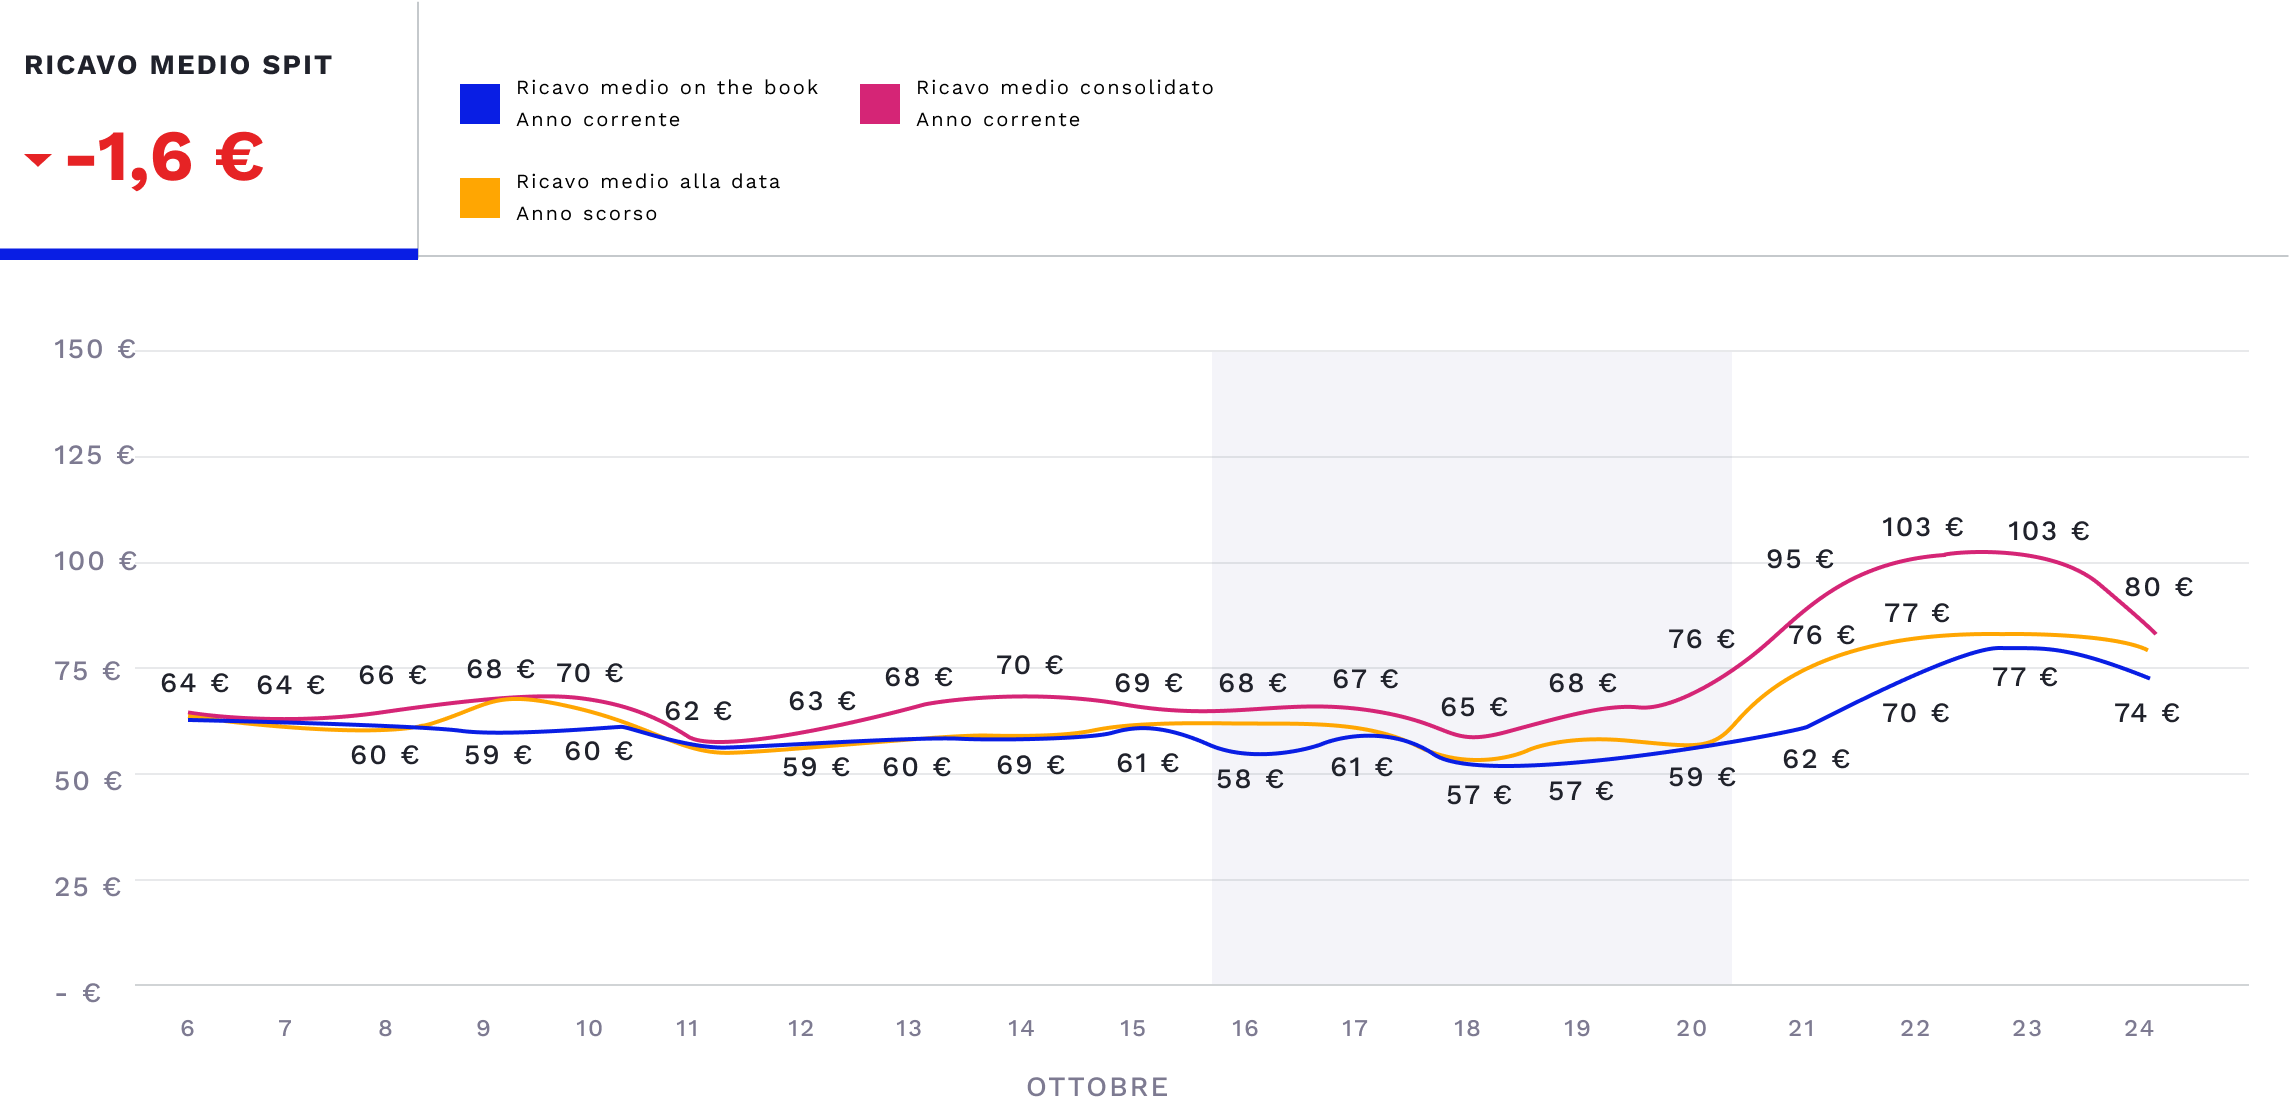
Same Point In Time (SPIT) statistics are one of the platform's most useful and important features. They allow you to compare your territory's on-the-book figures for the most important KPIs (number of rooms sold, ADR, average price excluding VAT and treatment value, revPAR, and total revenue) against last year's on-the-book figures, as of the same date.
The three lines appearing in the SPIT charts present 3 different colours: blue, yellow, and magenta. The blue line represents the on-the-book occupancy, the bookings received by your property for the next 90 days. The yellow line, on the other hand, represents the on-the-book occupancy as photographed on the same date last year, a snapshot of what was happening last year at precisely the same moment. Finally, the magenta one represents the consolidated data, last year's actual figures.