Compare the on-the-book figures for your property against last year's, as of the same date.
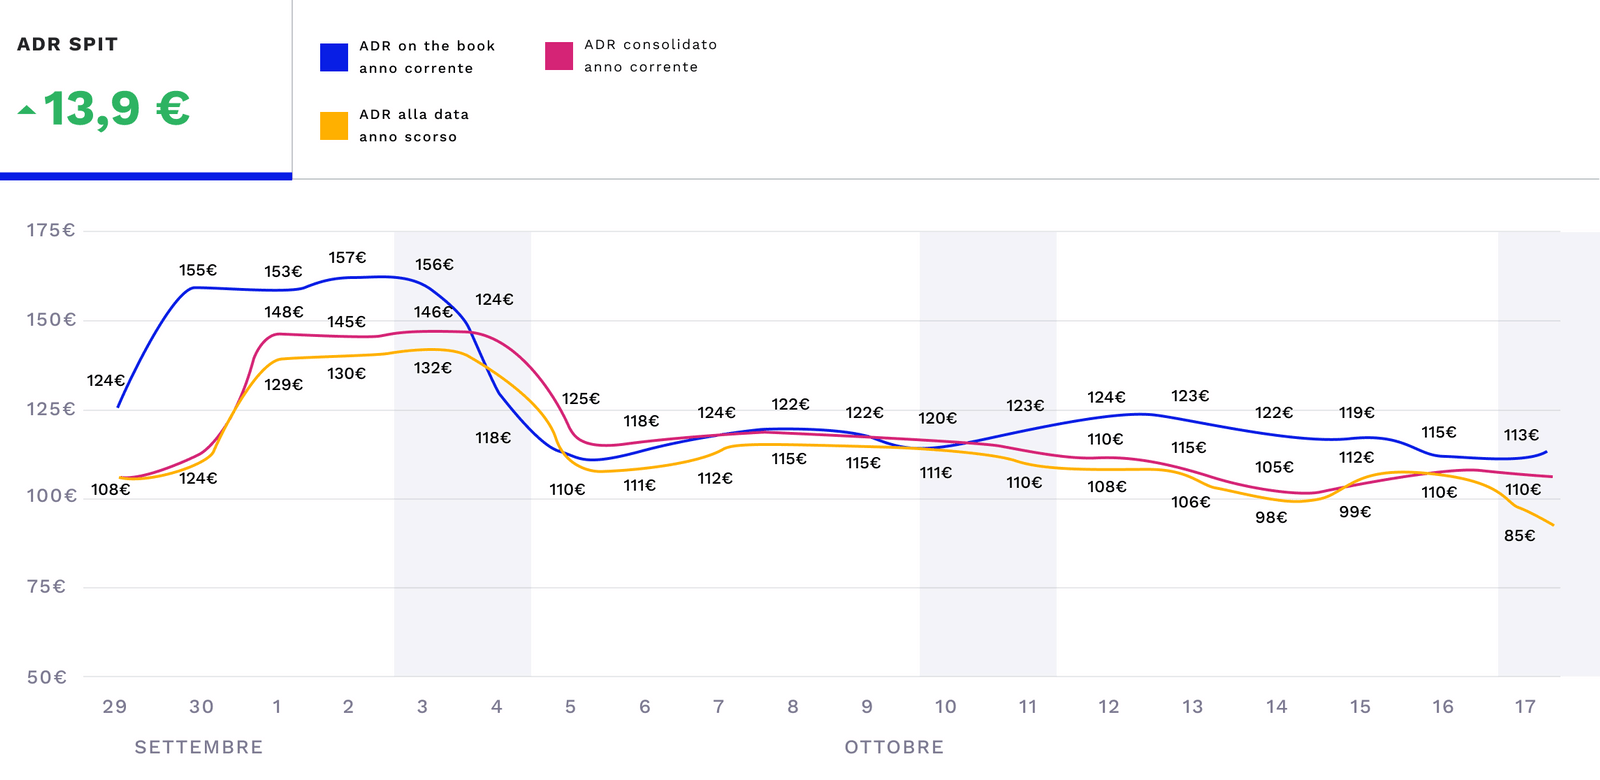
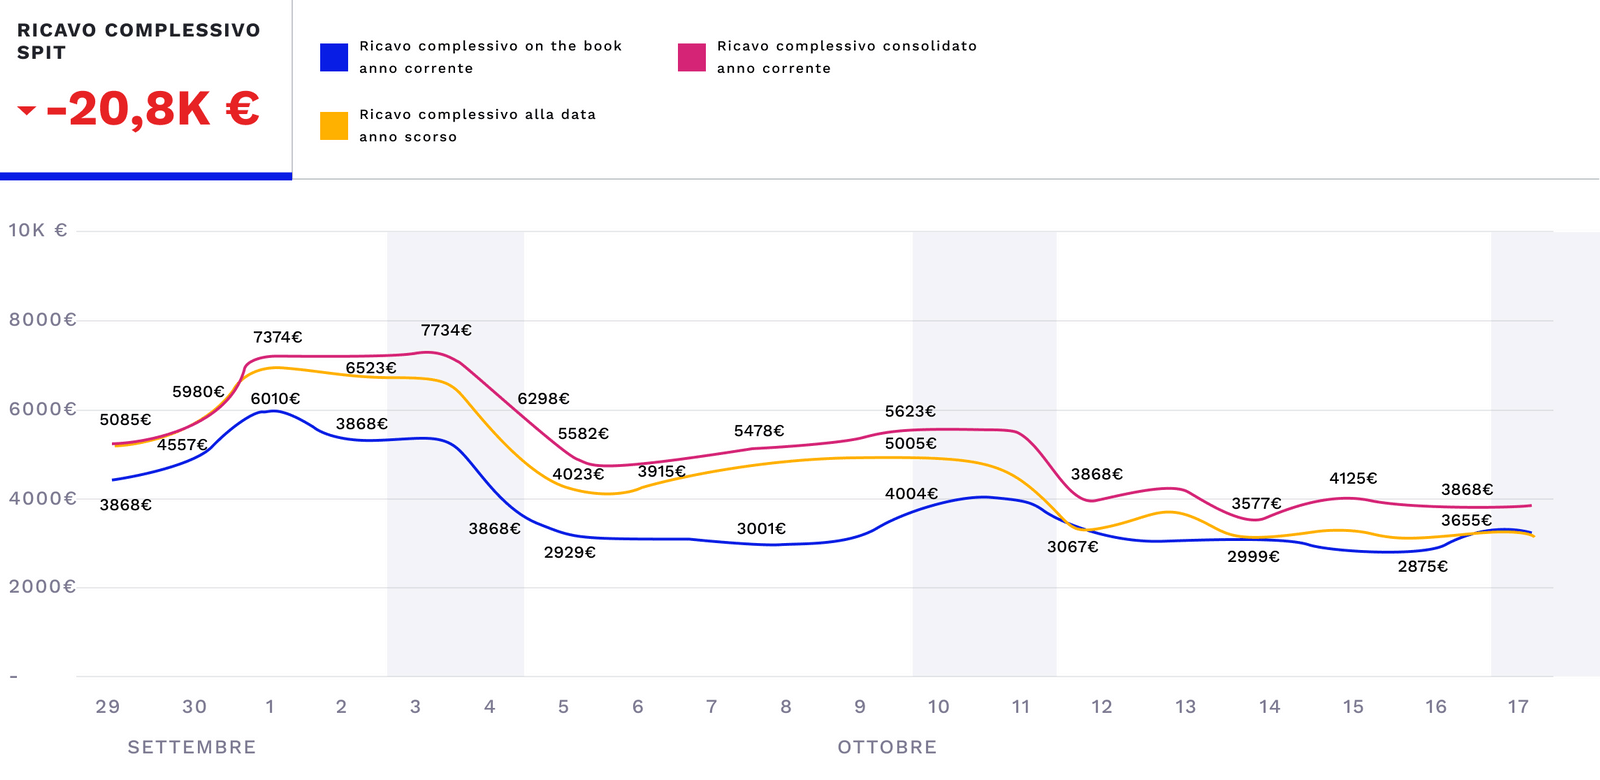
Same Point In Time (SPIT) statistics are one of the platform's most useful and important features. They allow you to compare your property's or territory's on-the-book figures for the most important KPIs (number of rooms sold, ADR, average price excluding VAT and treatment value, RevPAR, and total revenue) against last year's on-the-book figures, as captured on the same date.
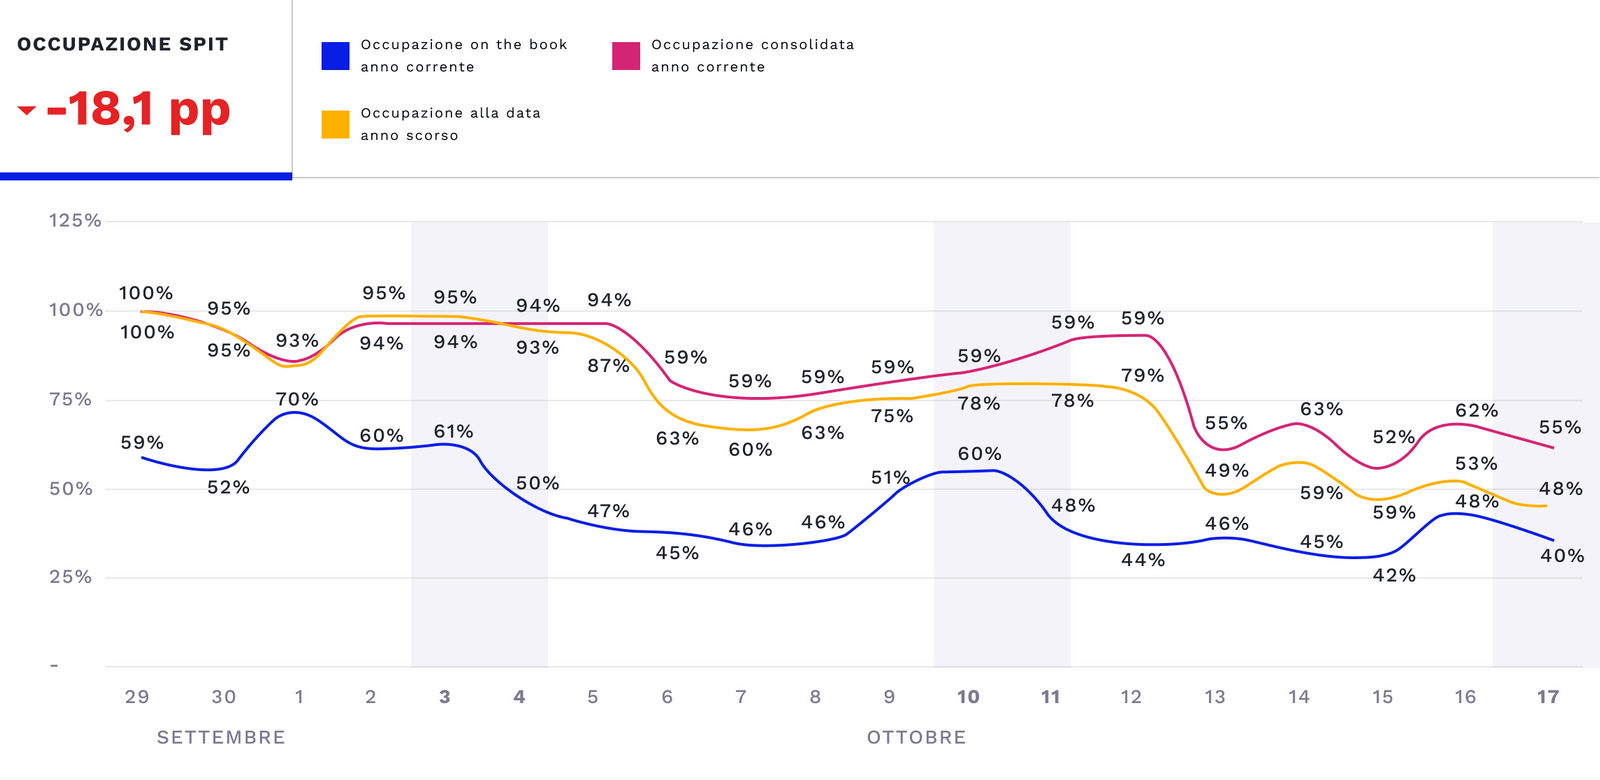
The three lines appearing in the SPIT charts present 3 different colours: blue, yellow, and magenta. The blue line represents the on-the-book occupancy, the bookings received by your property for the next 90 days. The yellow line, on the other hand, represents the on-the-book occupancy as photographed on the same date last year, a snapshot of what was happening last year at precisely the same moment. Finally, the magenta one represents the consolidated data, last year's actual figures.